American author Mark Twain famously stated: “It ain’t what you don’t know that gets you into trouble. It’s what you know for sure that just ain’t so.”
Likewise, digging deeper into data sometimes reveals a different picture from what you saw at first glance. Combing through reports from more than 1,200 weather stations across the United States, former University of Alabama climatologist John Christy’s analysis challenges a commonly held belief that extreme high temperatures have become more prevalent.
According to his report, published this spring in the academic journal Theoretical and Applied Climatology, the data don’t show an increase in extreme temperatures; rather, they indicate that temperatures have become more moderate over the past century.
“We have the systematic measurements in the United States that show the extremes of the [19]20s, 30s and 50s in terms of heat were much greater than the ones currently,” Christy told The Epoch Times.
“Even when you include the western parts of the country that are having their ‘1930s’ today, the rest of the country is not following the script.
“On balance, you don’t have a countrywide extreme event.”
The National Oceanic and Atmospheric Administration (NOAA) stated that average temperatures have risen by 2 degrees Fahrenheit since 1850 and that this increase has accelerated in recent decades.
According to NOAA, the year 2024 was the warmest year since global records began in 1850, and the 10 warmest years during this period all occurred during the decade from 2015 to 2024.
Regarding the cause, NOAA said that “Earth’s average surface temperature has been rising because human-produced greenhouse gases are causing Earth to absorb more energy than it radiates back to space.”
Christy’s study, however, indicates that, far from an increase in extreme weather, there has been an overall moderating of temperatures in the United States. In contrast to NOAA’s assessment, Christy’s analysis indicates fewer extreme high temperatures and extreme low temperatures since 1899.

Algorithms and Extremes
Given that Christy and NOAA are looking at the same data, how can there be such a large discrepancy?
The difference stems from two main factors, Christy says. First, NOAA’s chart shows average annual temperatures, while Christy focused on the highest and lowest recorded temperatures during the warmest and coldest seasons. The extremes, he said, are more relevant to climate science because they are setting the “environmental boundaries” in which plants and animals live.
The second reason for the different results, Christy said, is that NOAA employs algorithms that eliminate data points it believes could be errors or anomalies.
Christy’s research entailed going back through the original reports and collecting the extreme data points that NOAA had removed from its calculations.
It includes more than a century of weather station reports, from early handwritten notations by the Army Signal Corps and the Weather Bureau to measurements taken by the military and federal agencies today, all of which are collected in a central network managed by NOAA.


John Christy at the University of Alabama in Huntsville, Ala., on Aug. 12, 2026. Christy’s report says the data don’t show an increase in extreme temperatures; rather, it indicates that temperatures have become more moderate over the past century. JP Bond for The Epoch Times
NOAA’s figures raised questions and led to more research, Christy said, because some of what NOAA data showed as recent record highs didn’t match what he remembered from his own experience.
“When I was going through the federal data that’s digitized, I noticed that the government’s website says the hottest temperature in Newport, Oregon, in history was 94 degrees,” Christy said. “I knew a lot more about the West Coast because I grew up there.”
So he went back to the original handwritten temperature readings for that site and found not only a reading of 100 degrees in June 1925, but also 10 other days hotter than 94 degrees in Newport. He incorporated those missing numbers and then did the same for other reports from the more than 1,200 stations across the United States.

Handwritten records show daily temperature extremes in Newport, Ore., in 1925. The records here shows a reading of 100 degrees in June 1925, contradicting government data reporting the highest temperature for the area as 94 degrees, climate scientist John Christy said. National Centers for Environmental Information
To confirm that these extreme temperatures were not an error, Christy cross-checked his findings with other nearby stations to confirm they were getting similar readings.
“This takes a tremendous amount of manual intervention, and that is something we just don’t have today because everything’s done with AI or a computer algorithm,” he said. But without the original data, “you can’t quite get the true nature of climate and the type of rapid extremes that truly occur.”
“My data set is far more complete than what the federal government provides to scientific researchers,” Christy said.

NOAA public affairs supervisor Monica Allen stated that “NOAA does not comment on the findings of external studies,” but stated that “NOAA uses scientifically vetted quality assurance algorithms to identify and flag potentially erroneous observations and to detect abrupt changes in a station’s historical data that might be driven by non-natural factors, such as a station move or instrumentation change.”
“NOAA also receives input from our users to identify, review, and document erroneous observations in historical datasets,” she told The Epoch Times.


John Christy in the climate archives room at the University of Alabama in Huntsville, Ala., on Aug. 12, 2026. Christy’s research on temperatures differs from assessments made by the National Oceanic and Atmospheric Administration. JP Bond for The Epoch Times
However, by reincorporating data that the algorithms removed, and by focusing on temperature extremes rather than averages, Christy’s analysis indicates that the period with the most extreme high temperatures was the 1930s, not recent decades as is often reported.
Instances of extreme heat have not increased significantly over the past century, Christy stated, and there are fewer cases of extreme cold. The moderation of extreme cold temperatures is the key factor in the increase in average temperatures.
Urbanization and Nighttime Heat Release
In addition, the majority of the temperature increases Christy found occurred at night, with daytime temperatures largely remaining flat. He hypothesized that this indicated an influence other than just CO2 emissions.

“Nighttime temperatures have soared in the past 120 years,” Christy said.
“That is due to human development around the weather stations because nighttime temperatures are far more sensitive to urbanization—parking lots, buildings, removal of forests and so on—than daytime temperatures.”
Over the past century, many locations where temperature readings were taken have been touched by urbanization and suburban sprawl, with the construction of asphalt and concrete structures in formerly rural areas, he said.
These structures absorb heat during the day and release it at night, in addition to the removal of trees that once provided shade.
“You can’t pin it on greenhouse gases alone because the urban effect is so obvious in these stations,” he said. “It doesn’t take much to make an urban heat island—you can just build a parking lot next to a rural station, and you’ve got an urban heat island started.”


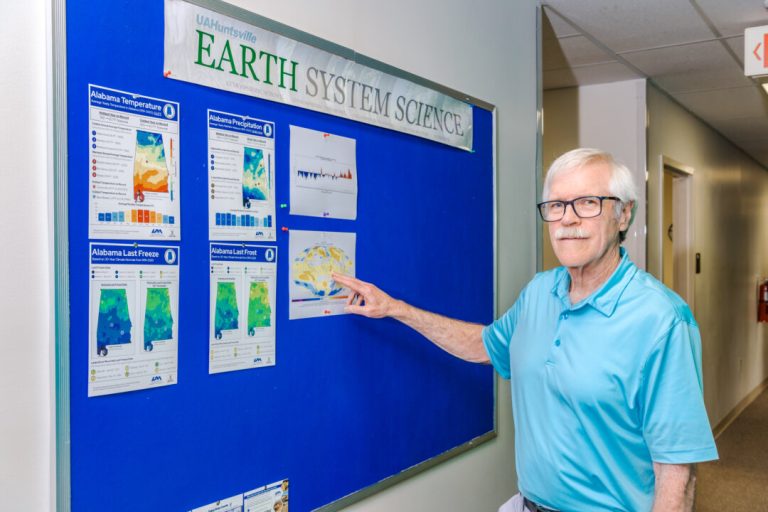
(Top) John Christy stands next to a radiation-shielded thermometer at the University of Alabama in Huntsville, Ala., on Aug. 12, 2026. (Bottom) John Christy looks at a board at the University of Alabama in Huntsville, Ala., on Aug. 12, 2026. Christy’s research entailed going back through original reports, including more than a century of weather station reports from early handwritten notations by the Army Signal Corps and the Weather Bureau. JP Bond for The Epoch Times
Temperature patterns are uneven across the United States, with heat waves currently more prevalent in western states but less so in eastern states than in the 20th century, Christy said.
But media reports focus on areas with the highest temperatures, reinforcing the public perception that extremes are increasing across the entire country.
Discerning weather patterns has been an obsession for Christy since his teen years growing up in Fresno, California, and continued through his college years studying mathematics.
After graduation, Christy worked on setting up weather stations in Africa, then earned a doctorate in climate dynamics from the University of Illinois, and later spent decades teaching college students atmospheric science at the University of Alabama.

Together with co-author Roy W. Spencer, Christy was awarded NASA’s Medal for Exceptional Scientific Achievement in 1991, as well as a special award by the American Meteorological Society in 1996 “for developing a global, precise record of earth’s temperature from operational polar-orbiting satellites, fundamentally advancing our ability to monitor climate.”
He was also a contributor to reports by the Intergovernmental Panel on Climate Change in the 1990s.
“I can go back to records I recorded 60 years ago,” Christy said, “so in a sense, I’ve experienced a whole lot of climate in my life firsthand.”


(Top) John Christy at the University of Alabama in Huntsville, Ala., on Aug. 12, 2026. (Bottom L) Christy was awarded NASA’s Medal for Exceptional Scientific Achievement in 1991, together with co-author Roy W. Spencer. (Bottom R) An array of awards (right) sit in John Christy’s office. JP Bond for The Epoch Times
Overcoming Objections
Getting his most recent findings published in an academic journal was no easy task.
“The reviewers tried to find anything they could to reject it, and fighting that takes a long time and a lot of effort,” Christy said.
“I had to overcome many objections, and I had to do some convincing by repeatedly going through a process of showing, ‘This is your objection, I have tested your objection, it’s incorrect.’
“There have been other papers we just never could get published. “That’s unfortunate because that means the world does not have a chance to see the results of this kind of research.”
Whether his findings will affect Americans’ views on climate change is uncertain, he said.
“If your political view is that extremes are getting worse and worse, that’s almost a religion, so you can’t really change minds on that,” Christy said.
“But if you’re someone who’s just dispassionately looking at information, my role in the past 50 years has been to build data sets the best I can so that we can ask questions of the data sets about these very kinds of issues.”
NOAA makes a wealth of data available to scientists for analysis using their own methods.

Alabama state climatologist Lee Ellenburg (L) and John Christy at the University of Alabama in Huntsville, Ala., on Aug. 12, 2026. Christy retired from the state climatologist role in January after more than two decades. JP Bond for The Epoch Times
It uses the nClimGrid-Daily program to analyze data derived from the Global Historical Climatology Network-Daily dataset, Allen said.
“This data set uses a broad set of daily stations in its analysis of US temperatures, and allows NOAA, the user community, and the science community to examine the full breadth of our data,” she added.

Average temperatures and extreme temperatures “provide complementary scientific insights,” Allen said.
“Average temperatures establish the historical baselines used to identify extreme conditions; extreme temperatures help address risks resulting from events such as heat and cold waves,” she said.”
Despite the abundant data NOAA provides, Christy believes it’s difficult for academics who question the prevailing narratives on climate to secure grants or be published.
“On an issue like climate change, it’s about as intolerant as they come,” he said.
“But I’m grateful to be here in Alabama where you still have the ability to ask questions and to examine the real data and not be fired for it.”